
Introduction
If companies have a central system monitoring based on Prometheus/Grafana, they want to integrate SwiftMQ metrics here as well. The Prometheus Metrics App provides metrics of the SwiftMQ router network connected to Flow Director through a REST interface in native Prometheus format.
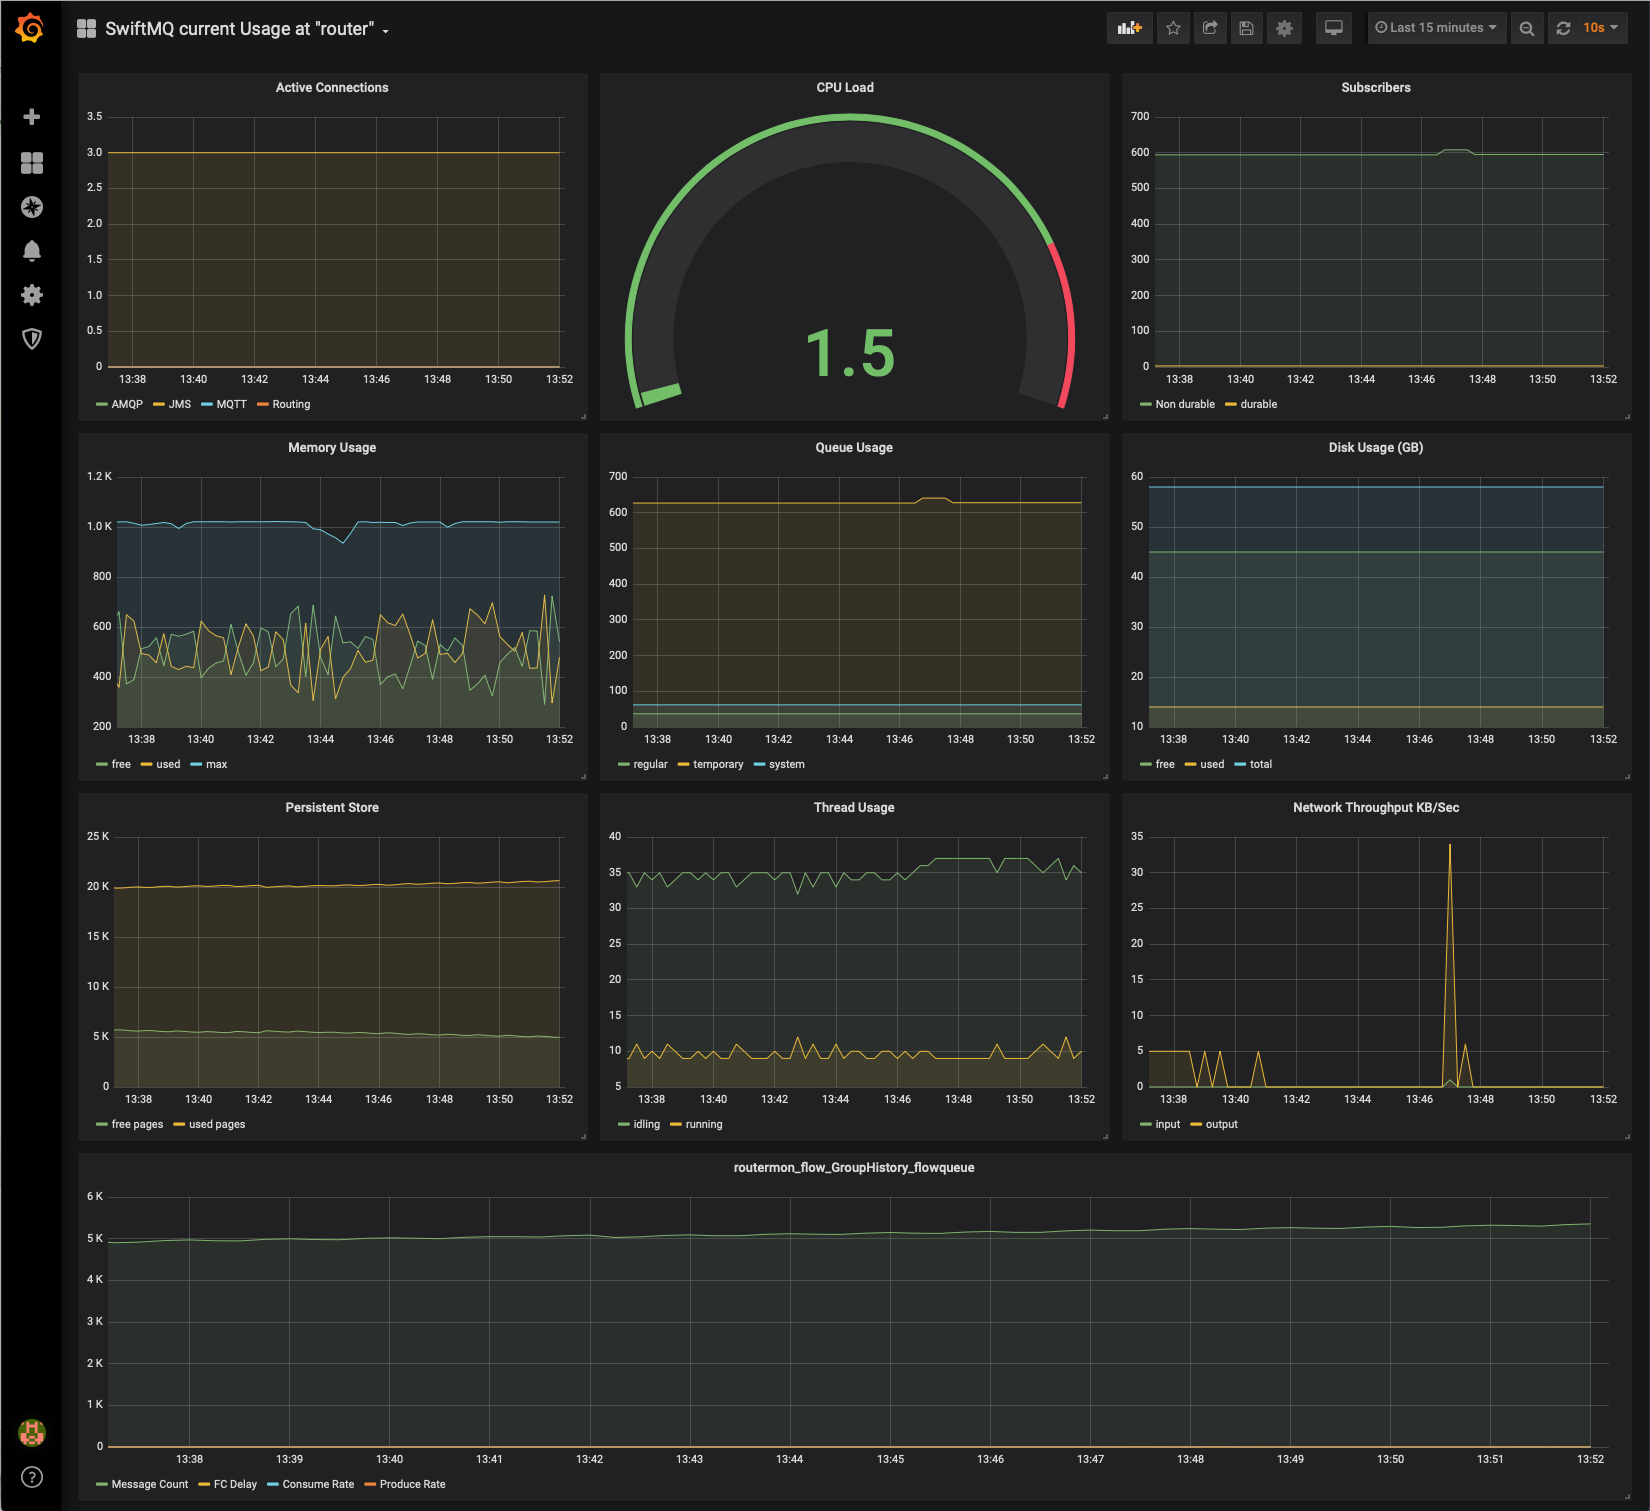
You can configure Prometheus to scrape this data so that it can be displayed in Grafana dashboards:
This app requires SwiftMQ 12.1.0 or later!