Use Explorer
As an Admin User
Below the App Configuration menu is the Explorer menu. Click on it brings up the Explorer.
As a normal user
A normal user doesn't have a menu. Explorer is immediately available after login.
Initial Screen
The initial screen of Explorer appears as follows:
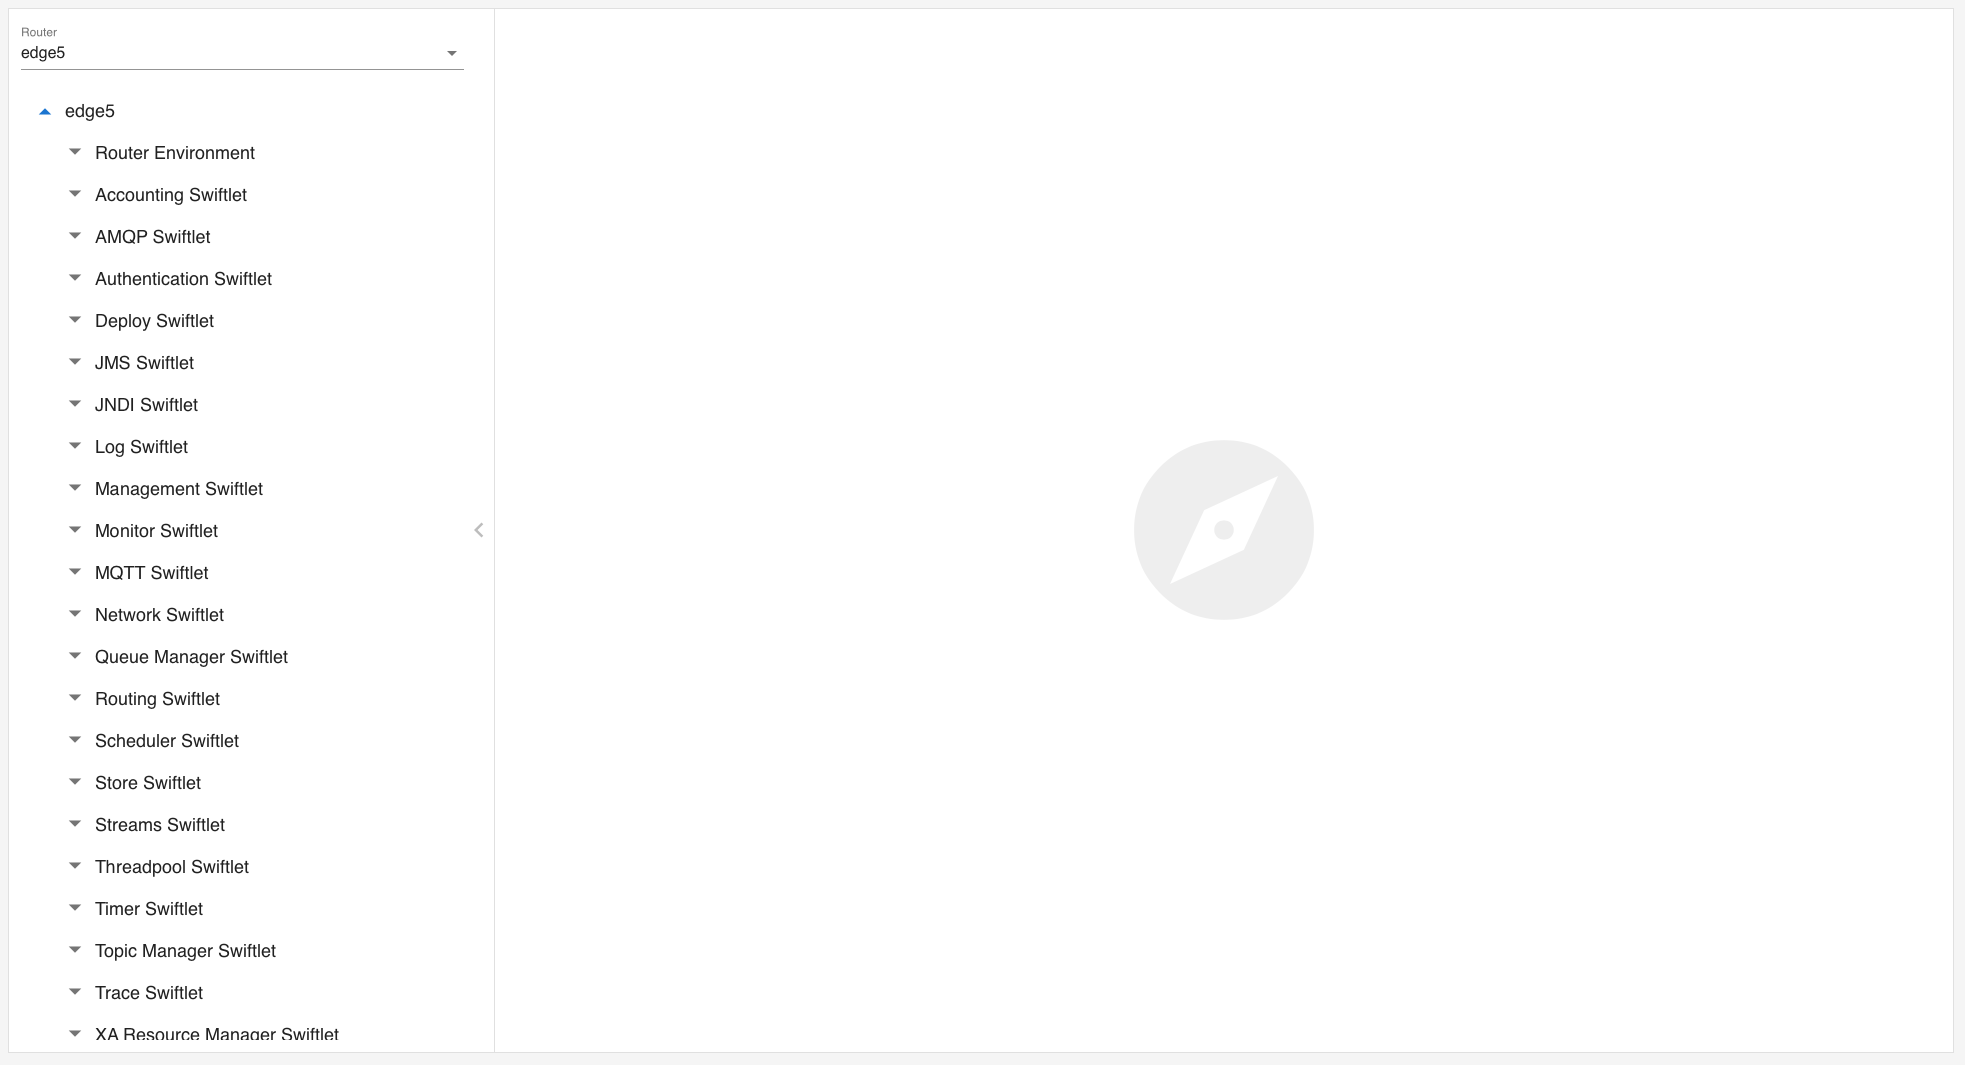
The upper left side contains a selector to select the router. Below is the management tree of the selected router. You can slide this panel in and out by clicking on the small arrow in the middle. Explorer automatically selects the first router that reports available. The right panel displays the content when you click on a node of the management tree.
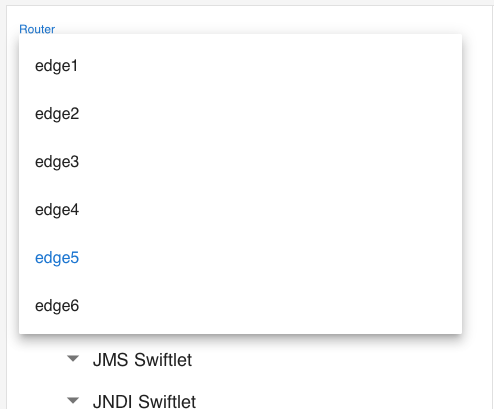
To switch between routers, use the selector at the top left:
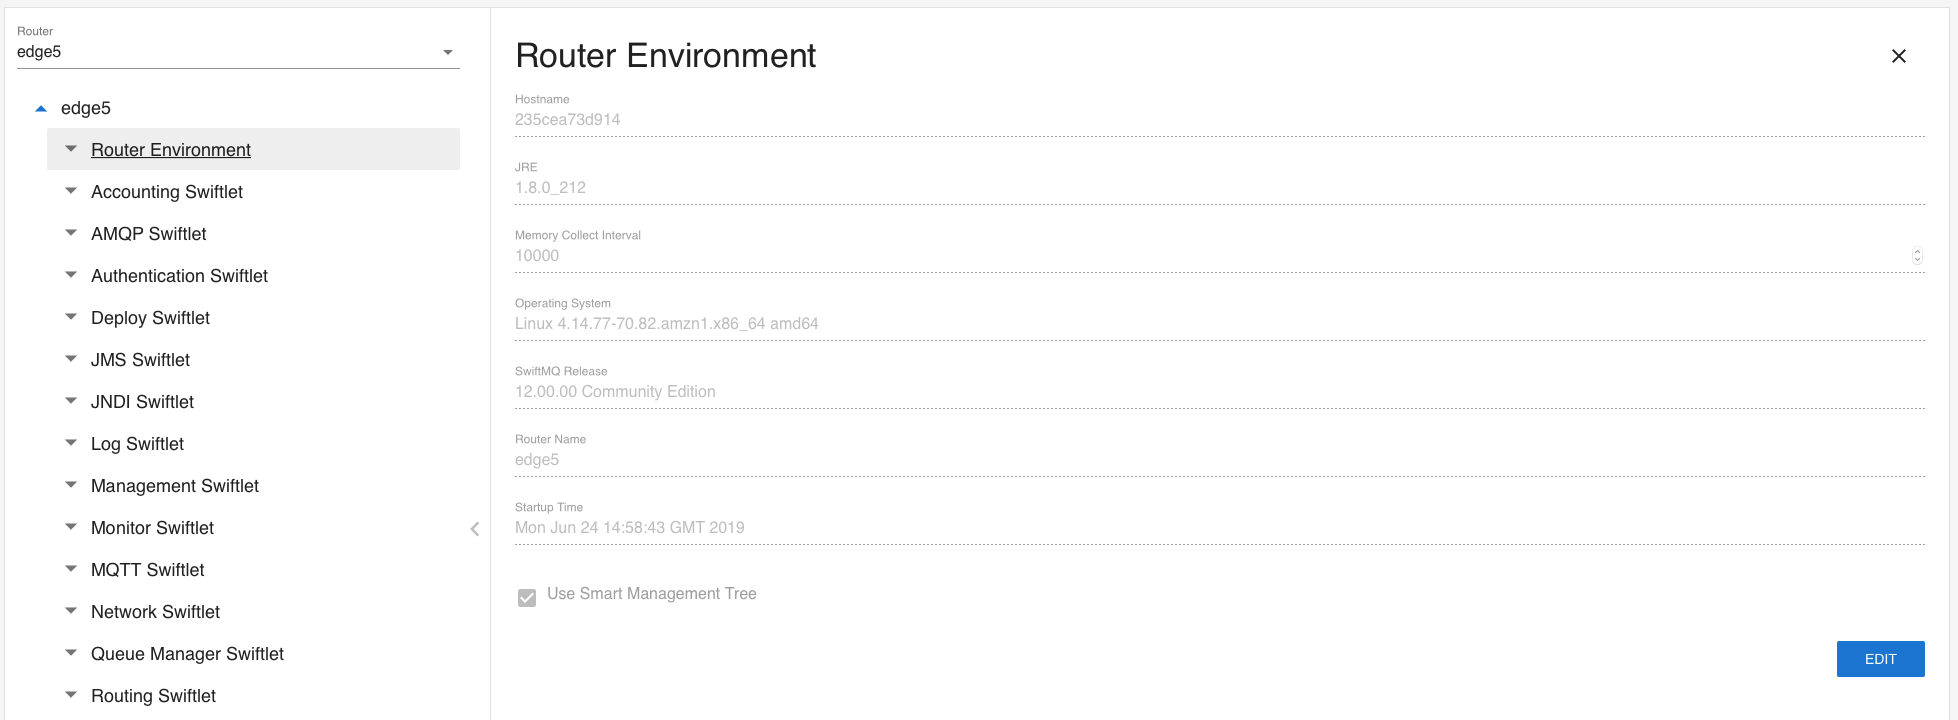
View Content
To view the content of a particular node in the management tree, click on it. If it is an entity, it displays the content in the content area:
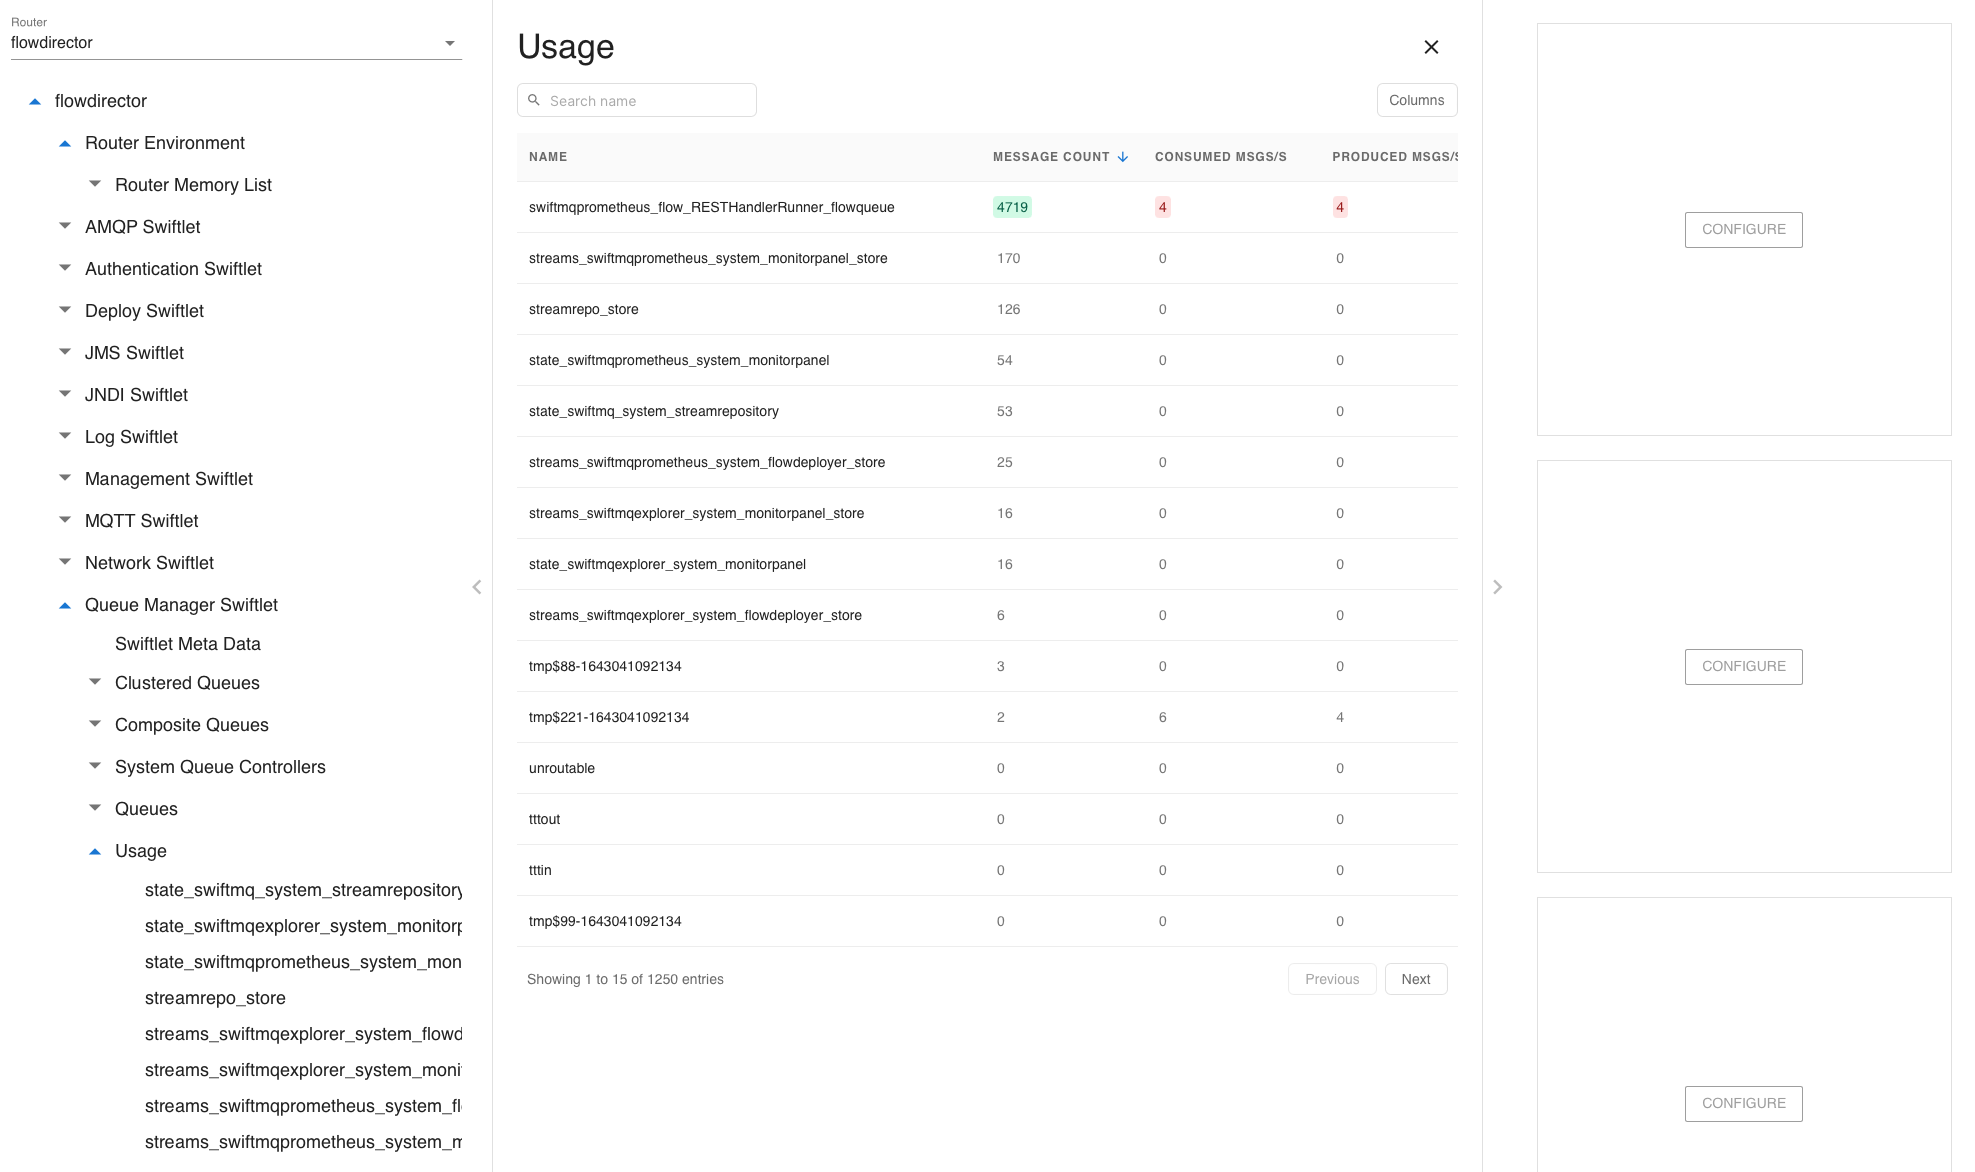
If it is an entity list, it displays the list as a table:
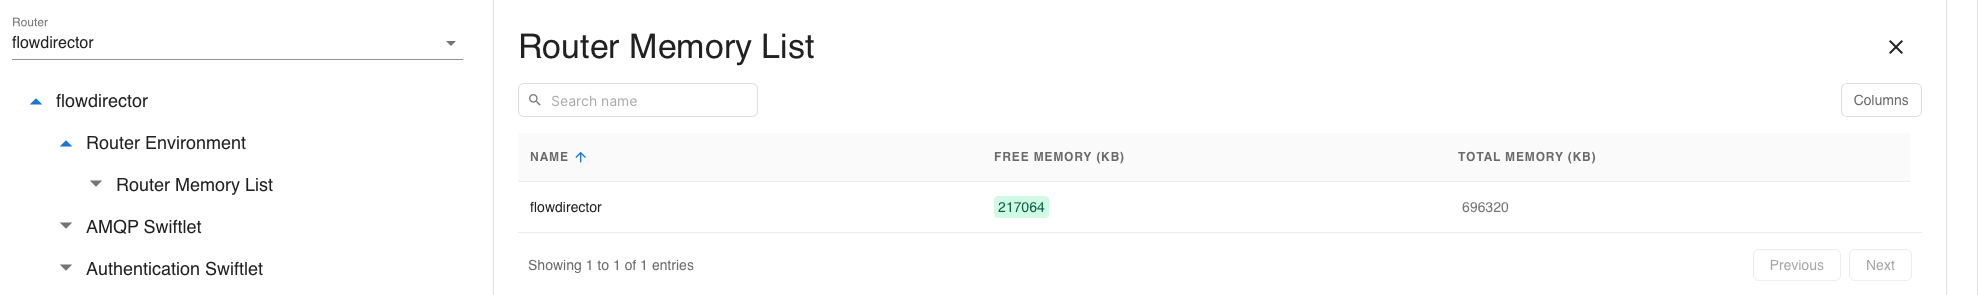
The content of a table is dynamic. Numeric values change their colors to red if the value has decreased and green if the value has increased. No color is used if the value is unchanged.
The content that is displayed can be filtered by specifying a string in the upper right Search field. The filter is applied against the entity names and is a contains filter.
You can use the upper left circle button to customize the displayed columns of the table. It is saved in the local storage of your browser.
Display Charts
Each table in the content area also has a chart area that you can slide in by clicking on the arrow on the right side in the middle:
The chart area has three slots to display three different charts. Click on CONFIGURE to configure each slot with a chart by selecting the columns you want to show. The configuration is also stored in your browser's local storage, so it is persistent after re-login until you delete it.
The charts are displayed in the configured slots:
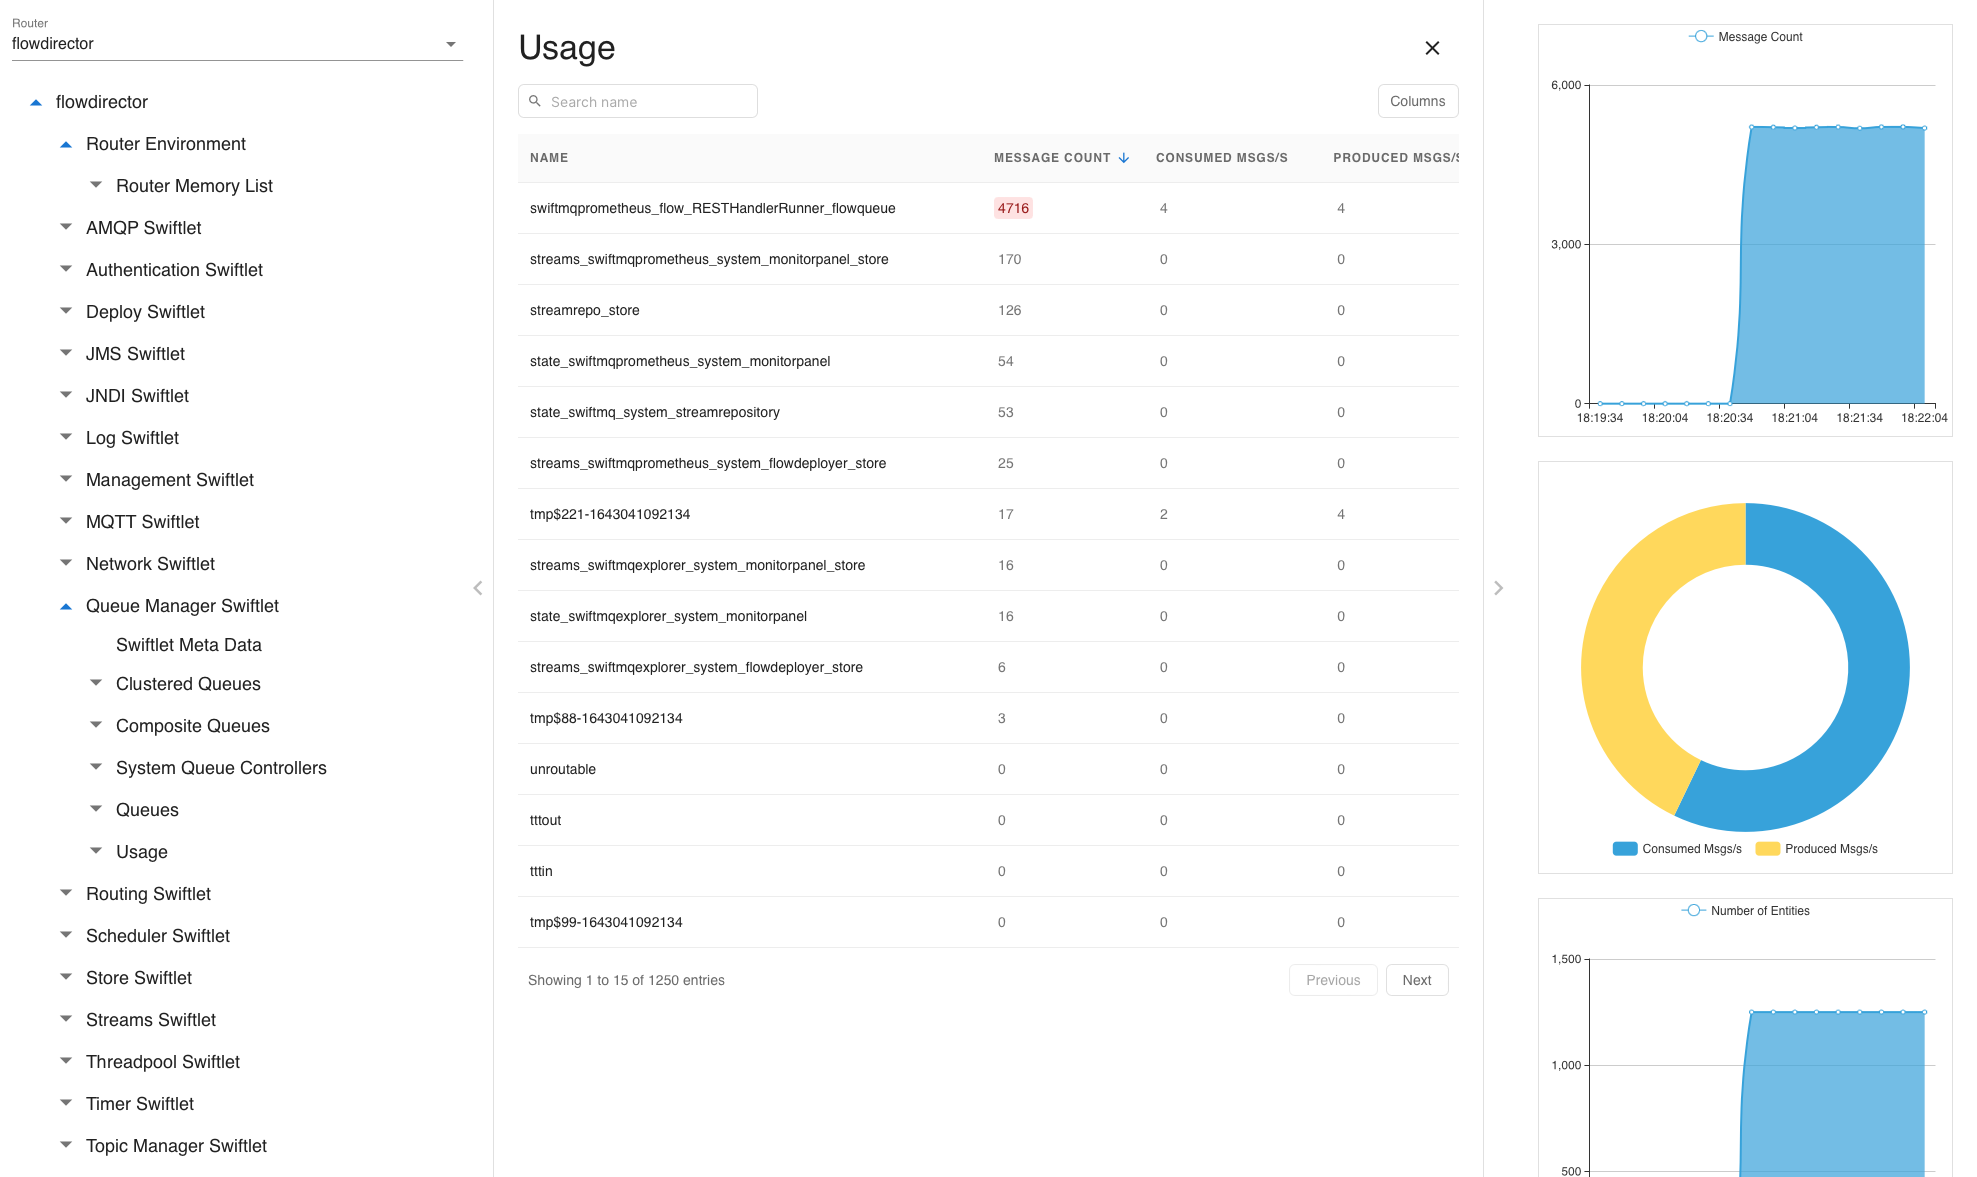
The charts display the current values with a history of 5 minutes (for area/bar charts). If you switch to other management tree nodes, data collection stops for these charts and is started new when you reselect this node.
Issue Change Commands
Change commands and their respective buttons are only available for users with read-write access.
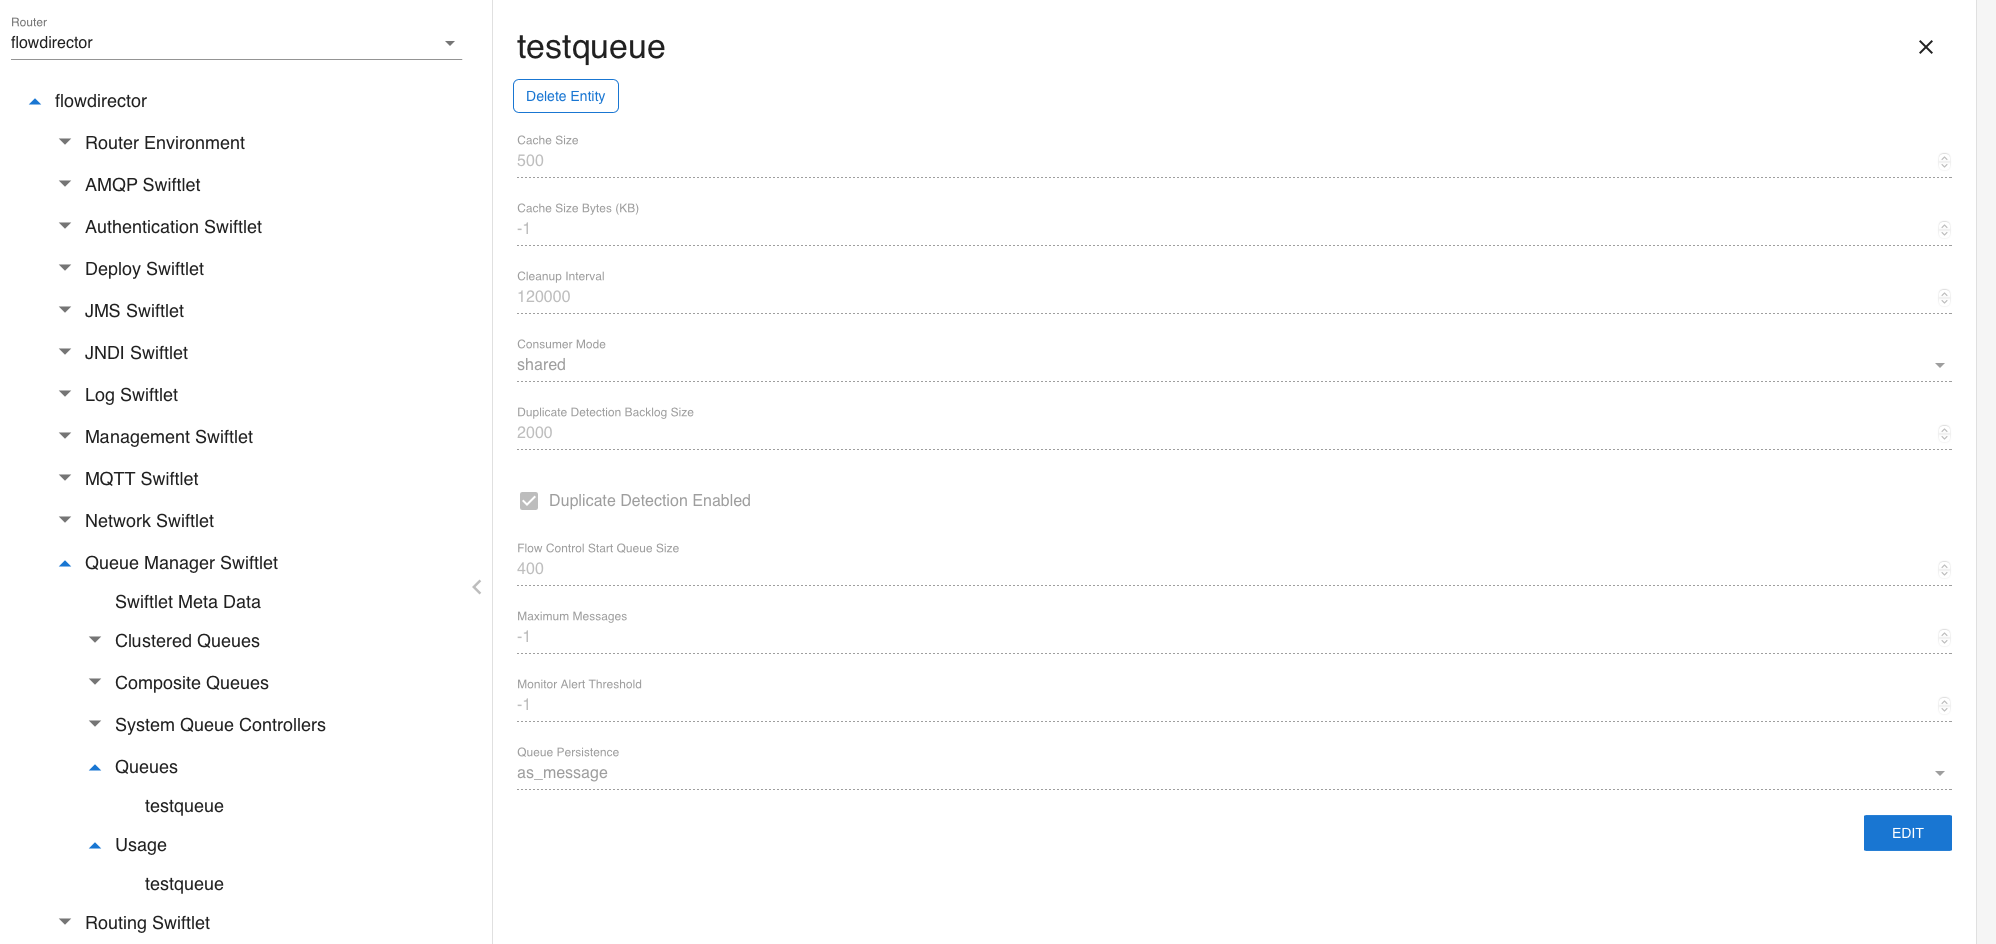
Entities
If an entity is selected, the content is displayed in the content area. To edit values, press the EDIT button:
Then change the values and click SAVE:
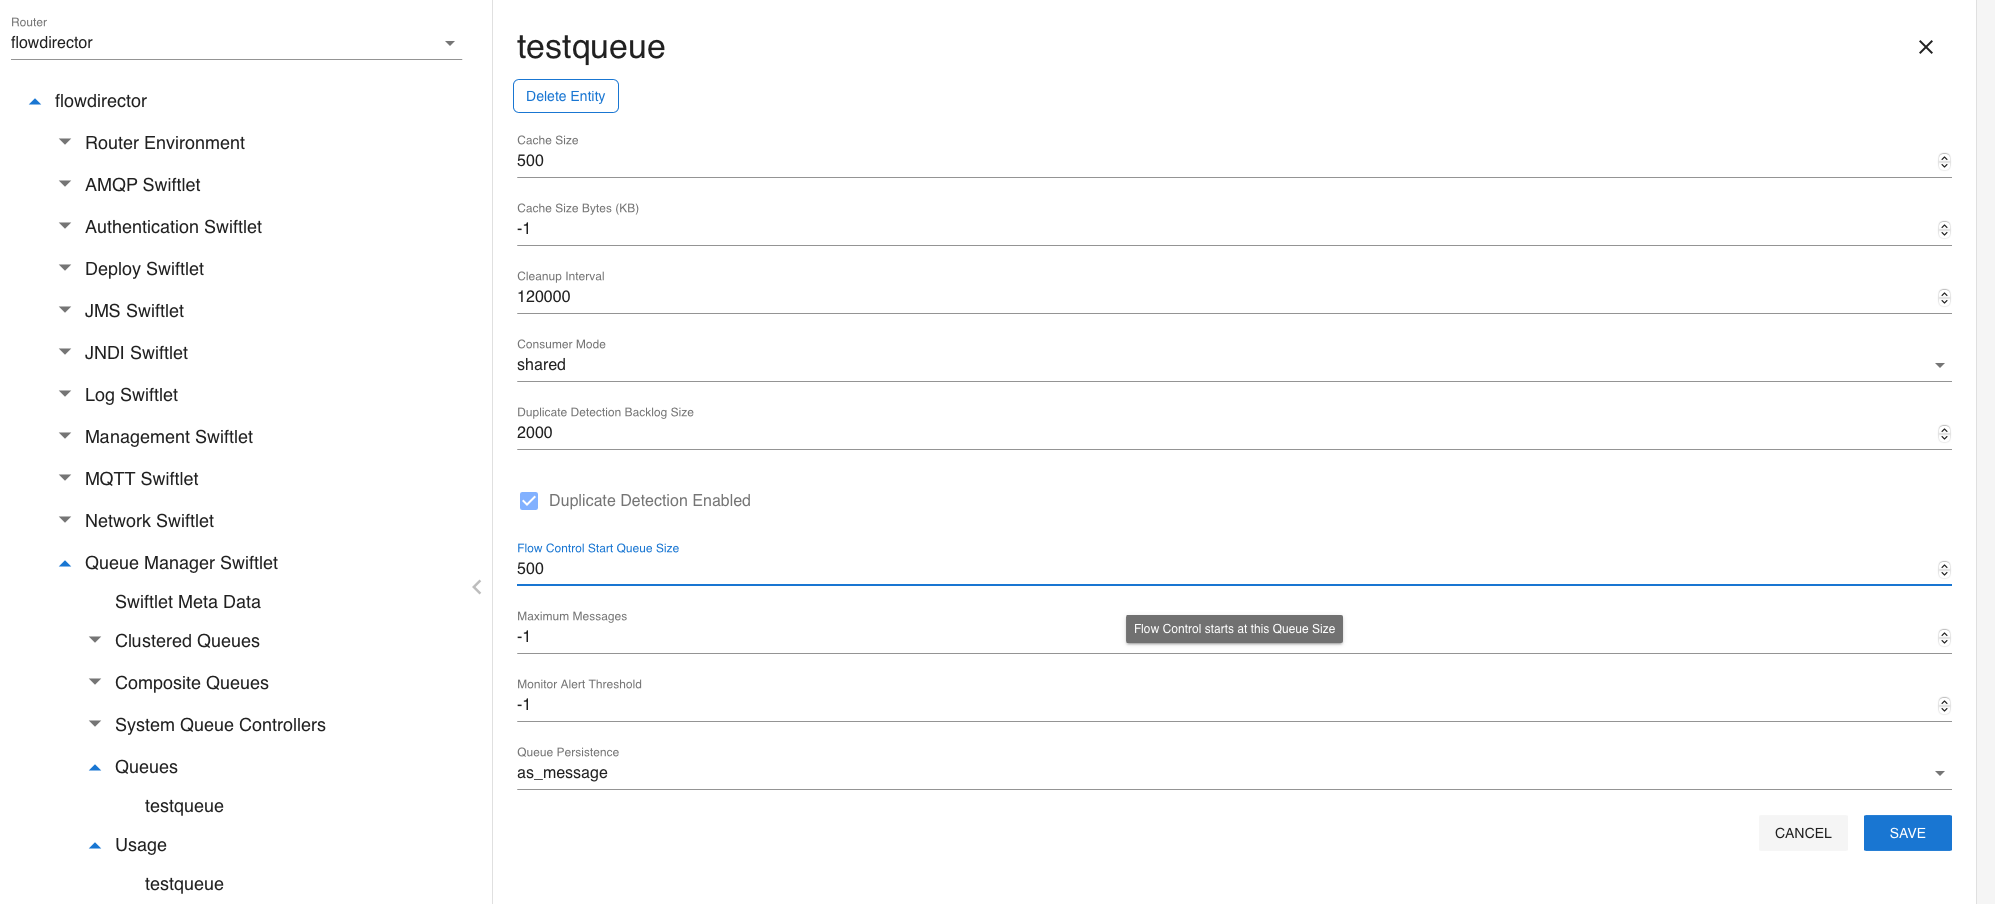
A DELETE button is shown if you can delete the entity. Click on it to delete the entity.
Changes are immediately saved in the configuration file of the SwiftMQ router.
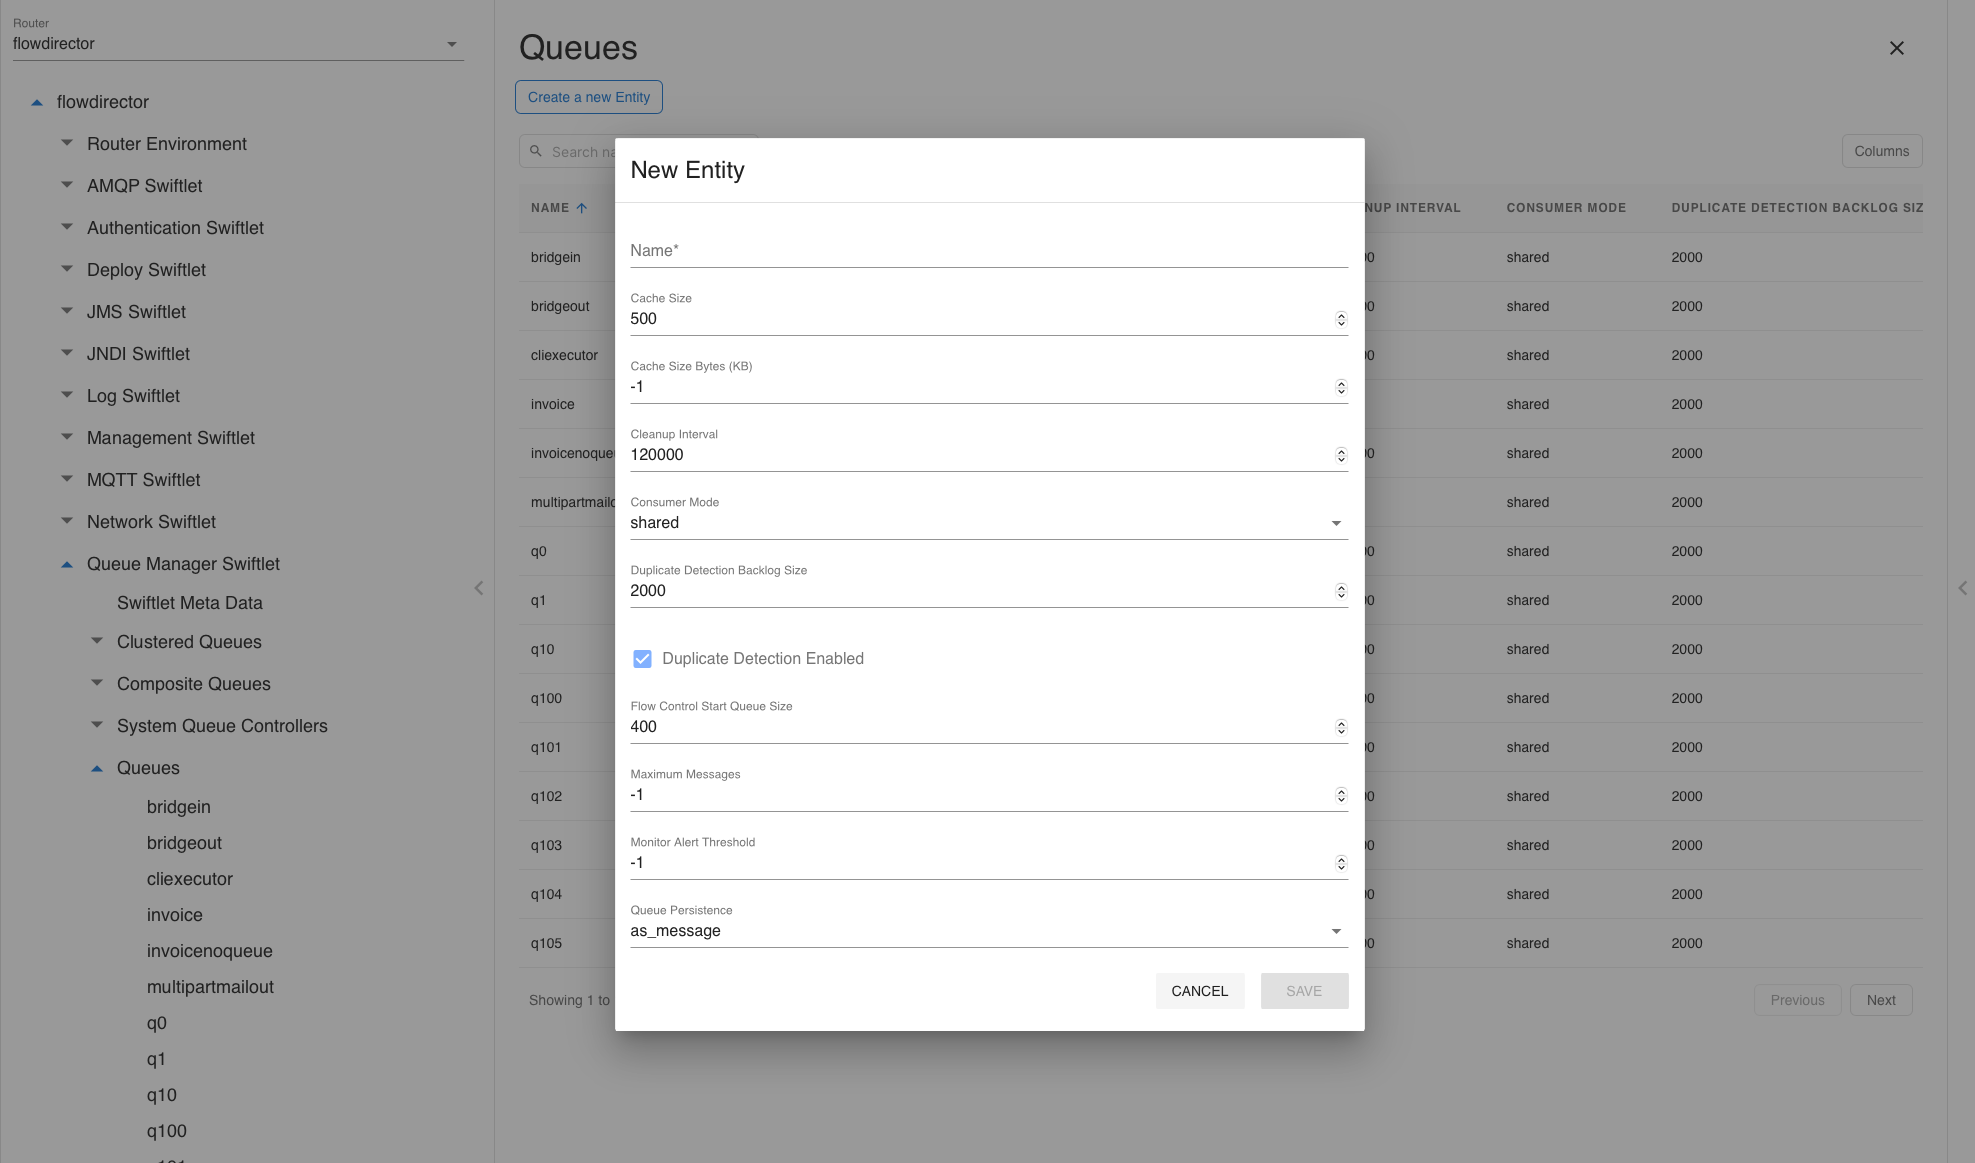
Entity Lists (Tables)
Nodes in the management tree representing an entity list (those with sub-nodes) are shown as a table. Commands that you can apply are displayed as buttons at the top left. Clicking on it will perform that command. This example creates a new queue:
Each entity in the table may have extra commands attached, which are shown when clicking on the name:
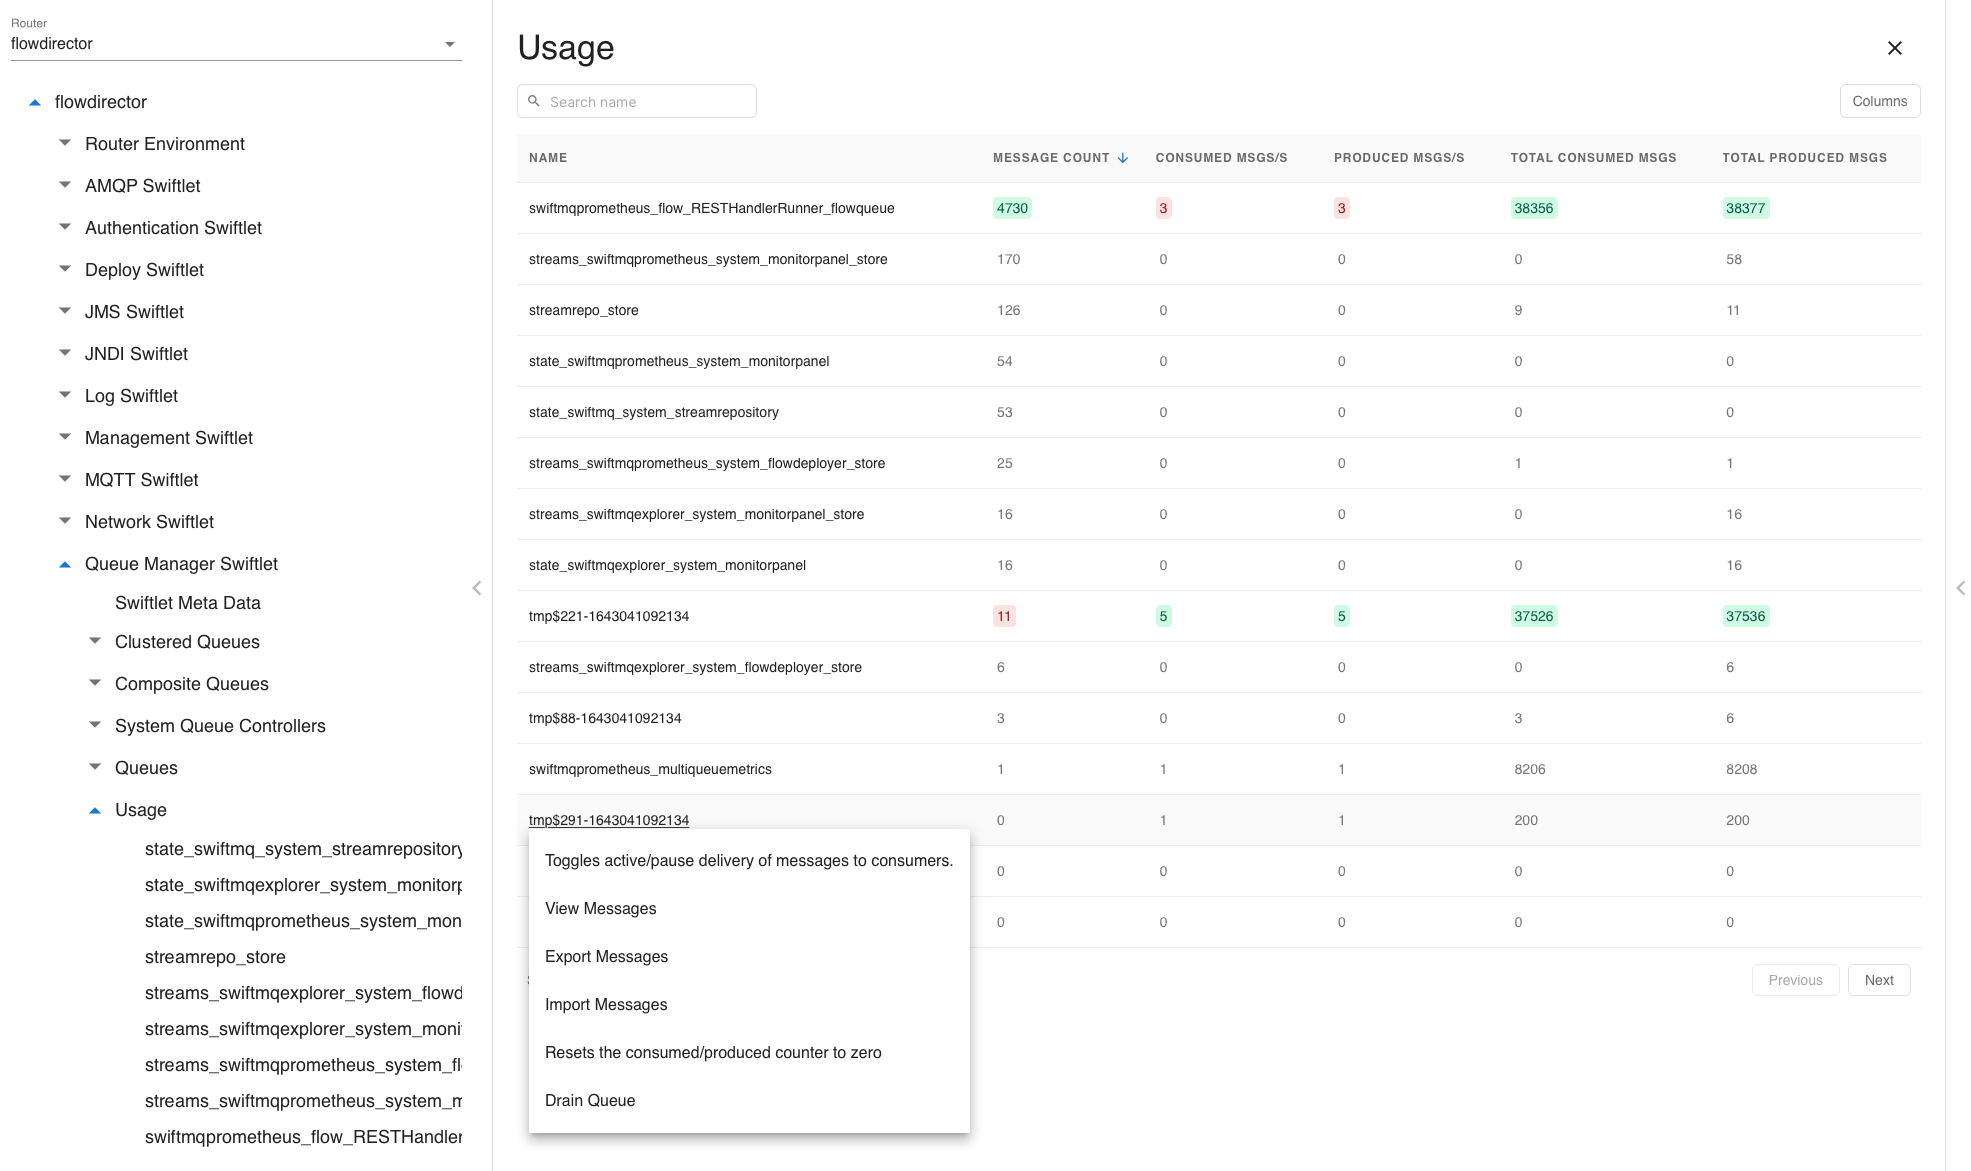
Note that all commands will automatically save changes in the router configuration file.
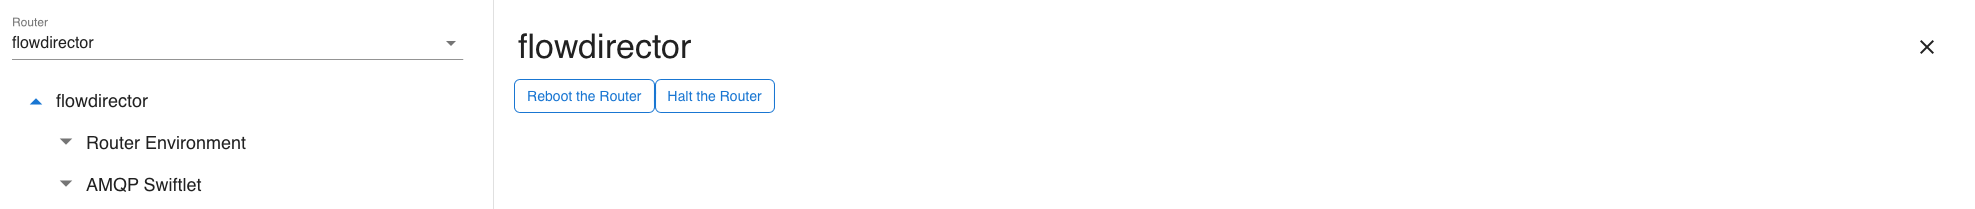
Router Node Commands
Some commands affect the router itself. These commands are shown if you click on the router node (top node):