Dashboard
This library contains components that generate data for graphical dashboard components like charts.
Probes
Probes are components that provide one or more values out of an input source. These components can be connected to dashboard Status Card components and History components.
Message
Messages probes extract values from properties of incoming messages and provide them as probe stream.
System
System probe are components that connect to the SwiftMQ router's internal management tree and provide the values as a probe stream.
Histories
History components build a history of the incoming data. Both History and Group History receive a probe stream from a Probe component and aggregate the values on the minute, hour, day, month, and year time frames. The output of a History component can be visualized by dashboard components Area/Line/Bar Charts while a Group History is visualized in a dashboard Group Chart.
Timeline components store begin and end timestamps of events and can be connected to a dashboard Timeline component.
Monitoring
Collects state messages from monitor components and builds a persistent history to display in a dashboard Monitor Table component.
Process Mining
Contains a Process Analyzer to create a realtime process model to display in a Process Viewerdashboard component.
Services
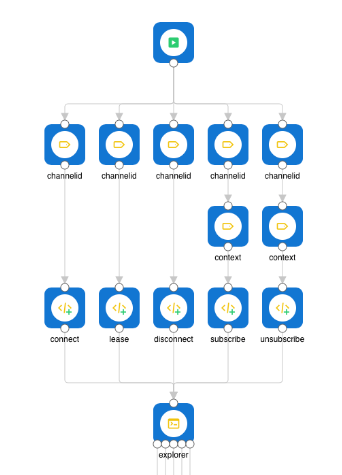
These components are used to create a shell that can be connected to a dashboard Terminal component. A shell is constructed by chaining Shell Command Parameters to form Register Shell Commands that connect to a Shell. Received shell commands are forwarded to command handlers that connect to the Shell component as shown here:

